



1Risk = standard deviation of monthly returns for the calendar year (percent).
History starts 2020.
MF Coach uses allocation-weighted sleeves. Lower is less volatile.
Fidelity Mutual Funds — Risk
Year1
MF Coach
FCBFX
FOCPX
FDVLX
FWWFX
2020
7.10%
3.13%
7.62%
11.42%
7.02%
2021
3.26%
1.12%
3.39%
4.14%
3.03%
2022
7.81%
2.98%
6.82%
7.74%
6.17%
2023
5.43%
2.86%
4.67%
6.53%
4.22%
2024
3.77%
1.67%
4.63%
7.58%
6.01%
2025
5.02%
0.83%
4.83%
4.13%
5.28%
2026
5.81%
1.14%
7.70%
4.57%
6.71%
As of:
08/27/2026
1Risk = standard deviation of monthly returns for the calendar year (percent).
History starts 2020.
MF Coach uses allocation-weighted sleeves. Lower is less volatile.
Vanguard Mutual Funds — Risk
Year1
MF Coach
VBLAX
VIGAX
VSGAX
VFSAX
2020
7.04%
3.17%
7.46%
9.08%
9.01%
2021
3.08%
2.56%
3.67%
3.57%
2.82%
2022
7.28%
4.54%
7.51%
7.07%
6.33%
2023
4.90%
5.18%
5.10%
6.68%
4.88%
2024
4.04%
3.08%
3.49%
5.61%
3.09%
2025
3.21%
1.90%
4.44%
4.14%
2.30%
2026
6.41%
2.31%
6.43%
5.55%
6.08%
As of:
08/27/2026
1Risk = standard deviation of monthly returns for the calendar year (percent).
History starts 2020.
MF Coach uses allocation-weighted sleeves. Lower is less volatile.
Risk is the standard deviation of monthly returns for each calendar year (percent). MF Coach uses
allocation-weighted sleeves within each family (USAA, Fidelity, Vanguard). Lower values mean less volatility over that year.
These tables use stored mutual-fund prices in our database—not delayed ETF market proxies on the homepage strip.
TSP Coach vs Other TSP Strategies
This chart is a comparison of TSP Coach to all TSP plans that change allocations once or twice a month.
Competitor comparison tables are TSP Coach–specific and are not installed on My Funds Coach. See performance and risk tables for mutual-fund results.
No TSP Allocation plan beats TSP Coach! Some plans have even stopped entirely.
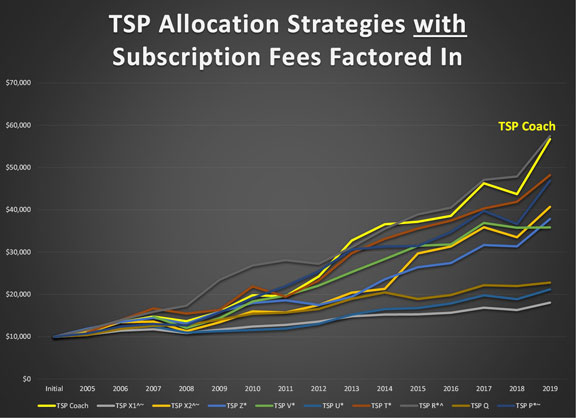
TSP Coach vs Other TSP Strategies with Fees Included
This chart is a comparison of the TSP Coach to the same plans, this time with Subscription Fees factored in.
TSP Coach has beaten all competitors over the last 22 years,
and therefore, we fulfil our mission statement of achieving the best returns with the lowest fees.
We want our program accessible to TSP investors just starting out on their journey towards retirement.
Calculation Data Behind the Charts Above
This is my data table for all of the TSP plans analyzed in the previous chart. The percentages do not include any subscription fees.
Detailed competitor data tables ship with TSP Coach only. My Funds Coach publishes mutual-fund family performance and risk instead.
* > 2 trades/mo ^ > 2 trades/mo before 2007 ~ Numbers on website have changed from 2015
I started with an initial value of $10,000 on January 1, 2005 and then compared my returns to other
fee based TSP newsletters based on the information available on their websites.
In cases where their programs started after 2005, I started them at the TSP Coach end of year fund
value in order to provide an easy comparison. Additional comments are noted in the table.
Contact Us
Success!
You have sent your message!
Submission Failed
Your funds. Your mix.
Workplace plans almost never list our exact funds. Map what you hold — we rebuild this month’s mix for your lineup.
1 See this month’s mix
We carefully analyze the markets and present our allocations. Same process as always: reallocation once a month.
2 Swap in what you actually hold
If your 401(k) doesn’t offer our listed fund, pick the closest one you do have. A quick search ranks close matches.
FOCPXyour fund
3 Generate your mix
We don’t just relabel our 67%. We run the same monthly method on the funds in your plan — so the split can change. That’s you taking control, not copying someone else’s tickers.
Coach 67 / 33Custom Weights for Your Funds
4 Save it. Next month is ready.
If you choose, we remember your matches. When the next allocation posts, generate again — your funds, this month’s call, no retyping tickers.
You now have a customized plan based on years of solid performance. Not personal advice.
Our scores. Your 401(k) menu.
We rank how closely other funds have moved with one you pick — using the same return history behind the monthly mix. Not a generic screener.
1 Start from a fund you know
Tap one of the published Coach funds (same tickers since 2020), a family (Fidelity, Vanguard…), or type a ticker. You don’t have to memorize symbols.
2 See what behaves like it
A 0–100 score. High 80s means the other fund’s recent returns lined up closely with yours. It is not a buy rating.
3 Drop it into My Fund Plan
Members: Use in Fund Plan puts that ticker onto the published mix so you can follow along with funds you actually hold.
Scores compare past returns and category. Not personal advice. Not a recommendation to buy or sell.
Similarity research
Find a fund that behaves like the one you don’t have
Our own scores — built from the same return history we use in the monthly mix.
Compare Fidelity, Vanguard, USAA, and T. Rowe Price. Not a generic screener.